Work/2026
KIRA: Electricity Theft Detection for Distribution Grids
Ranking the customers of an electricity distribution utility by theft risk from their consumption curve alone, and publishing the three promising results that failed their own checks.
KIRA ranks the customers of an electricity distribution utility by how likely they are to be stealing power, using nothing but each customer’s daily consumption curve. Non-technical loss is the industry term for the gap between the energy a distribution grid delivers and the energy it bills, and theft is the part of that gap a model can go looking for. The repo covers the whole path: public datasets, engineered features, LightGBM and deep networks with resumable training, and a dbt plus DuckDB medallion warehouse that turns model scores into the worklist an inspection crew actually receives. Training runs on UTEC’s Khipu HPC cluster under SLURM. Thesis in progress.
Highlights
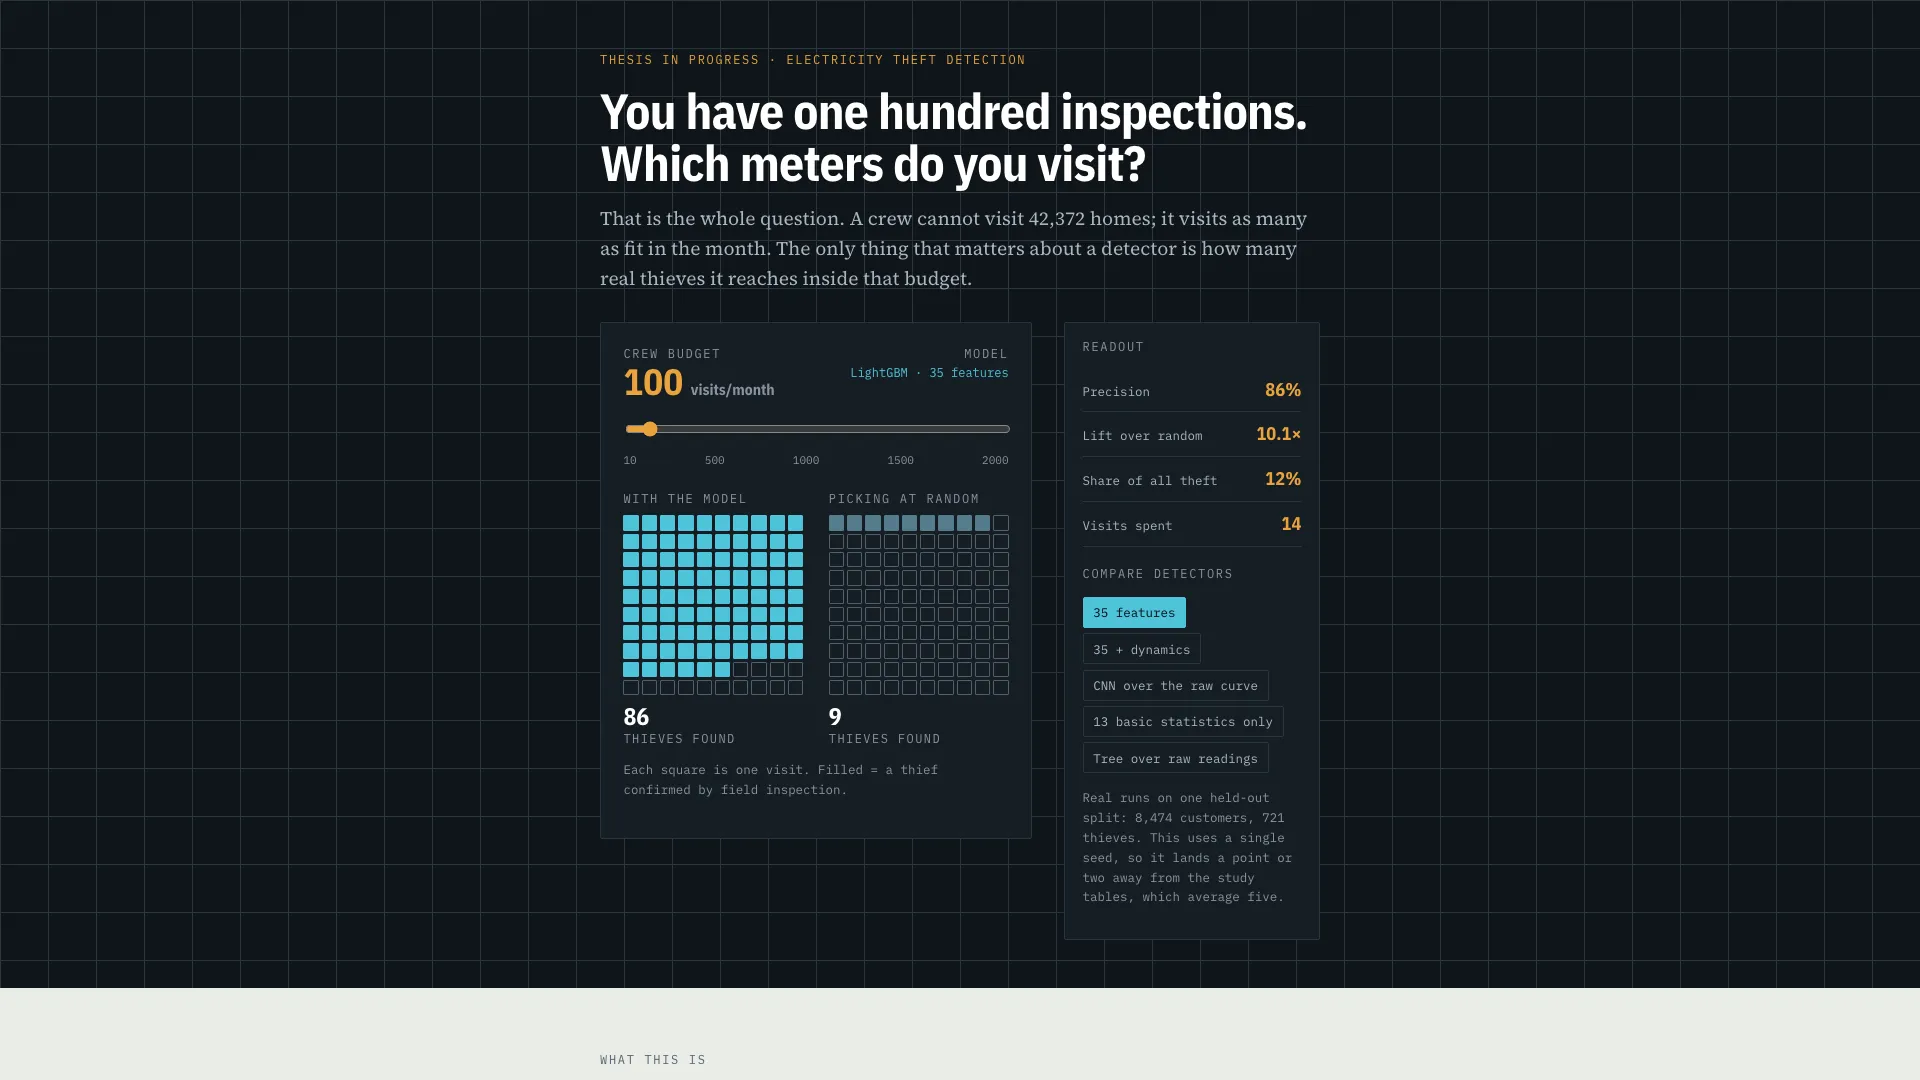
- A demo that runs the arithmetic in your browser. The public page hands you the real decision: you have one hundred inspections this month, so which meters do you visit? Moving the crew budget re-scores the held-out split of 8,474 customers live and fills a grid where each square is one visit. There is no server and no inference, because what ships is the measured ranking itself, 5 KB compressed, so the page cannot contradict the study behind it. The alternative considered first was exporting the model to ONNX, which would have cost 10 MB of WASM and allowed float32 drift away from the published numbers.
- The metric follows the crew, not the model. At 8.5% prevalence a detector that answers “nobody steals” is right 91.5% of the time and worthless. What a utility can act on is bounded by how many meters a crew can physically visit in a month, so the number that decides adoption is precision inside that budget. Of the 100 worst-scored meters, 83 are confirmed theft against 9 for a random pick. AUC-ROC is reported alongside for comparison with published work, and Precision@K is what the project optimizes.
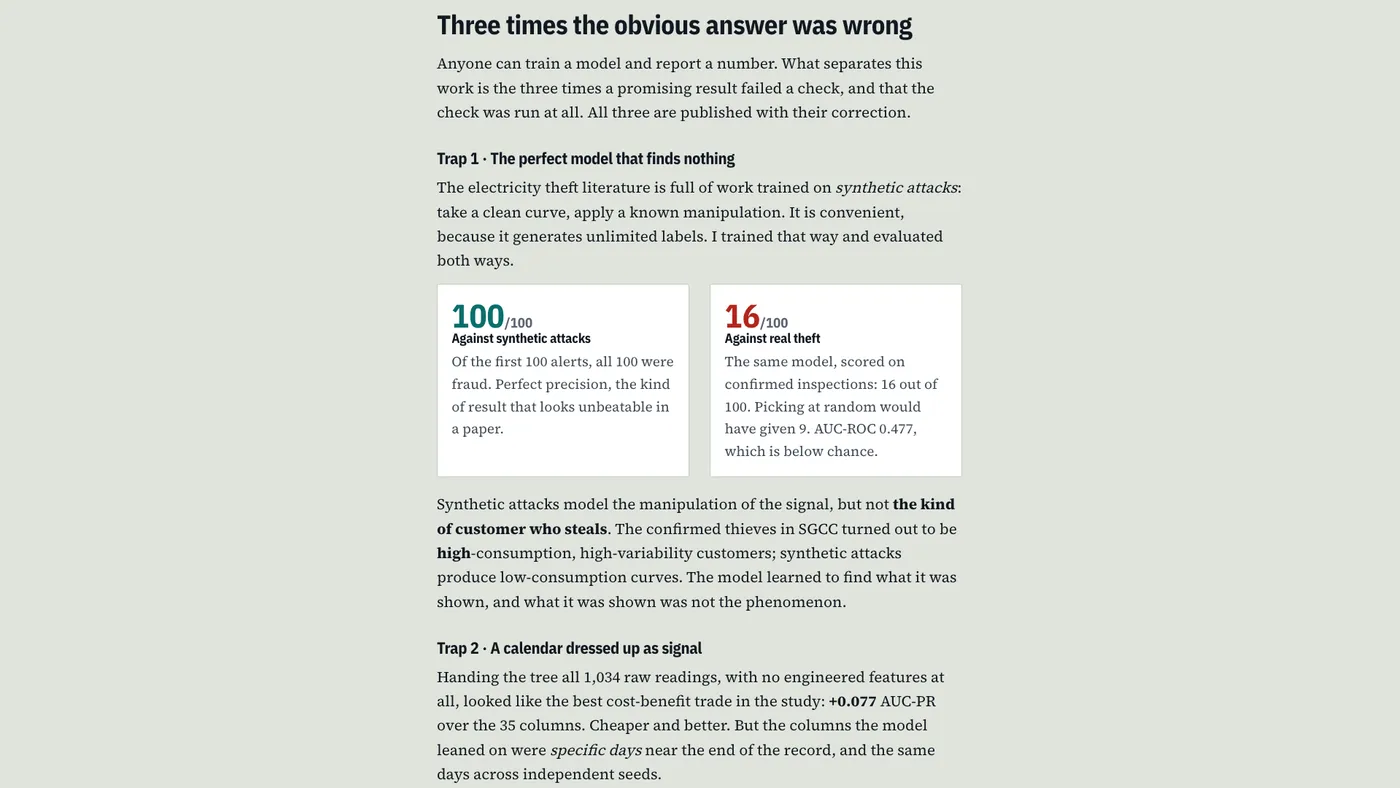
- First result that failed its check: perfect on synthetic attacks, near-random on real ones. Most of the electricity-theft literature trains on synthetic attacks, which are cheap because they generate unlimited labels. Trained that way and scored both ways, the same model called all 100 of its top synthetic alerts correctly and 16 of its top 100 real ones, keeping 24.9% of its precision, with an AUC-ROC below chance. The cause is specific: synthetic attacks lower consumption and teach that low consumption means theft, while SGCC’s confirmed thieves are high-consumption, high-variability customers. The model learned the phenomenon it was shown, and it was shown the wrong one.
- Second: a calendar that measured like a signal. Handing the tree all 1,034 raw daily readings with no engineered features looked like the best trade in the study at +0.077 AUC-PR. The columns it leaned on turned out to be specific days near the end of the record, the same days across independent seeds, because SGCC’s columns are calendar-aligned and the inspection campaign happened on a date. Repeating the run on the first 80% of the calendar drops that gain to +0.025, while the CNN’s +0.069 survives at +0.066. Without that test the study would have recommended the opposite of what it now recommends.
- Third: a feature family that could not carry information. Ten
features compared each customer against the whole population through
(x - mean) / stdand a percentile rank. Computed with global statistics, both are monotone transformations of the column they come from, and a tree splits on thresholds, so they were the same column twice over. The measured rank correlation was 1.0000. Rebuilt to compare inside groups of similar consumption, which is what the family claimed to do, it measured worse than its own absence at −0.0075 and lost on five seeds out of five, so it was removed and the baseline went from 45 columns to 35. - Better model or better data, answered in cost order. Both axes were
measured over the same split with five seeds and a paired bootstrap. An
ensemble of tree and CNN reaches 0.572 AUC-PR against a 0.468 baseline, the
CNN alone 0.537, the new
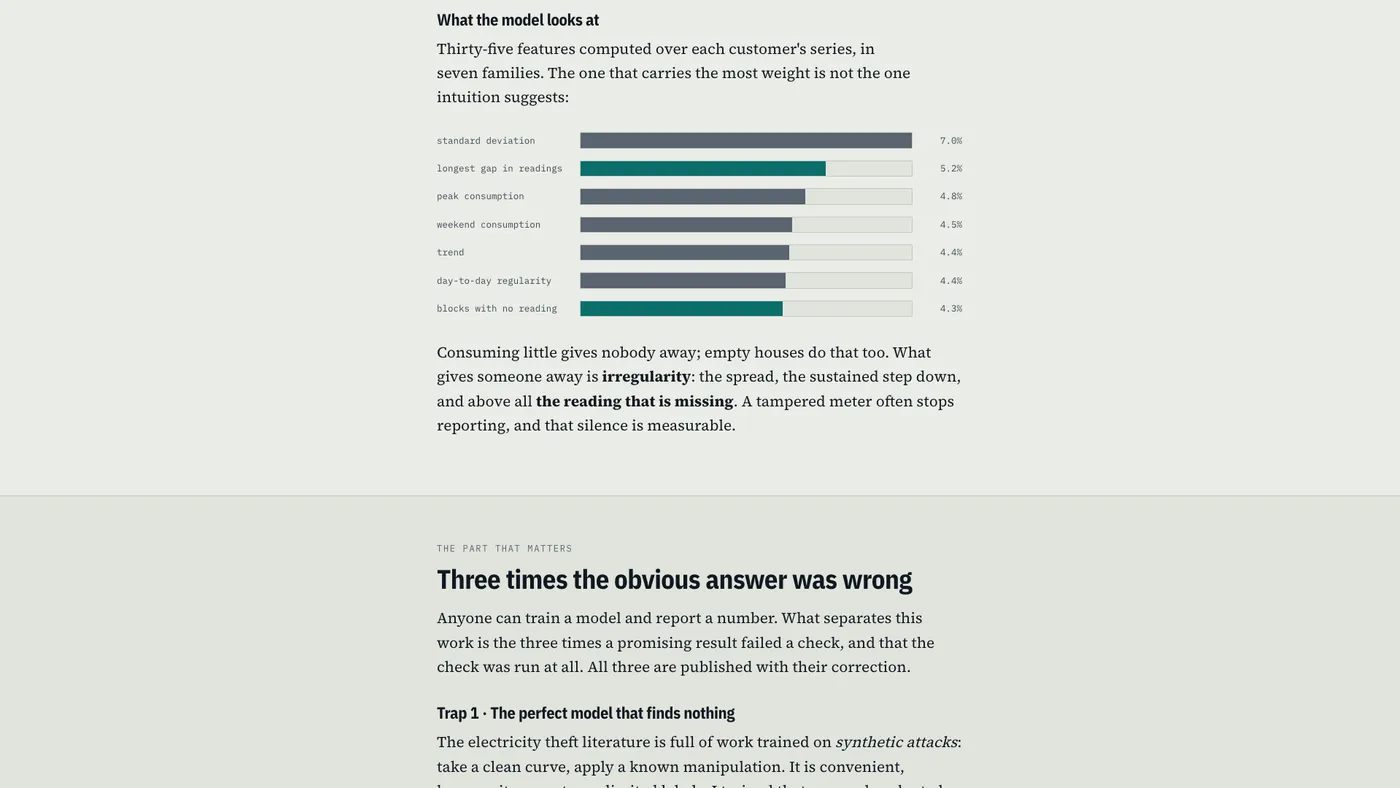
dynamicsfamily 0.496, and a properly configured PatchTST lands at 0.463, tying the tree rather than beating it. Features come first because nineteen columns of numpy win on five seeds out of five for a second of CPU. The GPU earns its place only above a certain budget: at 100 visits a month the options sit inside each other’s intervals, and at 1,000 visits the network finds about 50 more cases. - Intervals before conclusions. With 8,474 test customers the confidence interval on Precision@100 spans 19 points, wide enough that ranking architectures by eye on that metric orders noise. Every comparison in the study carries its interval and its per-seed win count, and the two arms that top the raw AUC-PR table are flagged as the ones the next section argues against.
- From a score to a crew assignment. The medallion warehouse runs about 165 quality checks and ships a selftest that injects seven real defects one at a time, verifying by name that the test claiming to catch each one does fail. Bronze keeps every value as text because a missing meter reading is signal here rather than noise. Gold produces a budget-aware inspection worklist with per-customer reasons, and publishes measured kWh instead of currency, because the four parameters that convert energy into money were uncalibrated and one of them was wrong by a factor of four.
- Built for an eight-hour wall clock. The cluster QoS terminates any job at eight hours, so training checkpoints atomically, watches a SIGUSR1 sentinel and persists RNG state alongside the weights. Interrupting at iteration 50 and resuming reproduces the exact AUC of an uninterrupted run. The access tooling budgets SSH attempts on disk because the cluster locks accounts after three failed logins, and 219 tests run without downloading a single dataset.