Work/2026
Free-Market Energy Forecasting
Demand and load-profile forecasting for Peru's free-market industrial clients, from the COES settlement Excels up, with a public demo and a scoreboard that scores itself every month.
An ELT pipeline and a forecasting stack over the settlement files COES publishes for Peru’s wholesale electricity market, which carry the same 15-minute energy series the market is billed on across 5,353 metering points and 72 months. A Rust binary catalogs, downloads and loads the portal’s Excels into TimescaleDB; dbt conforms them into per-client profile marts and leak-tested feature panels; and a Python package predicts how much each industrial client will draw next month and next day, plus the shape of when they draw it. A public demo serves the result, and a monthly agent scores the model against reality without anyone touching it.
Highlights
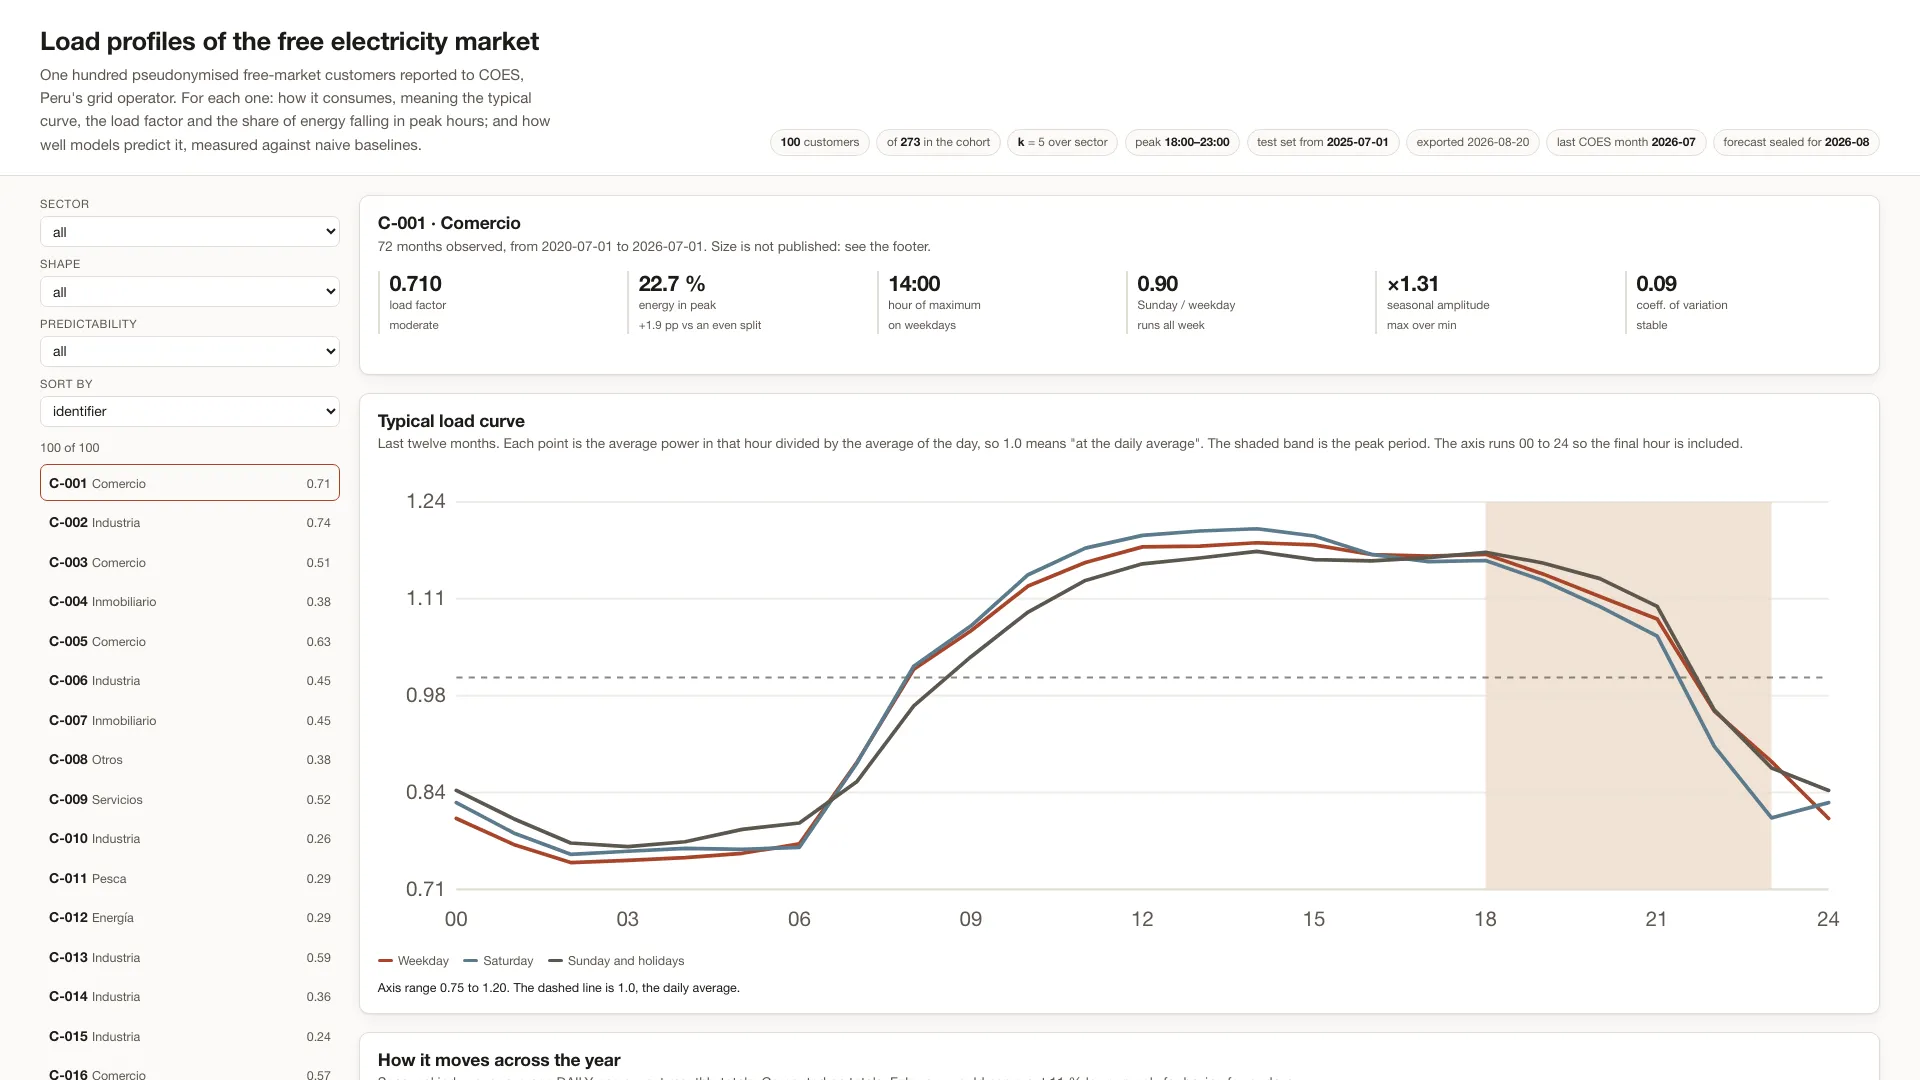
- A public demo that publishes no consumption level at all. Pick a free-market client and see how it consumes and how well the models predict it: typical 24-hour curve by day type with the tariff peak band marked, seasonal index, month-by-month trajectory, and a table of eight forecasters. No table carries MWh, MW or currency. Removing the company name is not enough on its own, since a 40 MW mine is recognizable by size alone, so what actually prevents identification is that the shape cannot be joined against a billed consumption. It came for free, because every product metric was already a ratio.
- The anonymity is built rather than checked afterwards. Sector quotas are filled with at least five clients each. The first version did the opposite, selecting first and then collapsing attributes until the number passed, which reported k = 100 with zero attributes published. A later review found that removing the size band from the client table left it in a second table that is served whole, recoverable for 36 of 100 clients by a trivial join. The page also states the limit it cannot close: a load curve is close to a fingerprint, and anyone holding a client’s real curve can recognize it there.
- A scoreboard that grows without being edited. COES publishes a month’s load between the 5th and the 10th of the next one, and a launchd agent runs daily, exiting in seconds when there is nothing new. When a month lands it ingests, transforms, checks, scores, retrains, promotes, seals and exports. A data gate runs seven plausibility checks first, the most valuable being a unit check, because a panel that switches from MWh to kWh stays internally consistent and passes every completeness test. The board separates sealed forecasts, archived with their SHA-256 before the data existed, from backtests computed afterwards. It starts seeded with thirteen test months and wins twelve, and the month it loses is in the table and highlighted.
- The floor is the whole problem. “Next month looks like this month” already predicts 93.6% of the energy correctly, so the acceptance criterion is beating a subtraction rather than reaching a threshold. What moved the result most was the unit of prediction rather than the model: with the target in raw MWh the same LightGBM does worse than doing nothing, because the panel spans 3 MWh a month to 400,000 and a few clients own the loss. Predicting the ratio against each client’s own recent level turns −18% into +25% monthly and −28% into +40% daily. On the held-out window the model reaches 95.4% of portfolio energy a month out against the naive’s 93.1%, and the typical client’s daily error falls from 25.8% to 16.2%.
- Two metrics that disagree, kept on purpose. Weighted WAPE answers how much of the portfolio’s energy was mispredicted and is decided by ten enormous clients; median per-client MAPE answers how well a typical client is predicted and is decided by the long tail. Reporting only the first passes a model that ignores 1,700 clients, so the hyperparameter search is multi-objective and returns a Pareto front. The same discipline killed a segmented model: a separate arm for distributors, which are 42 entities but 48.2% of the energy, won on validation and lost on test, trained on about 1,300 rows and overfitting.
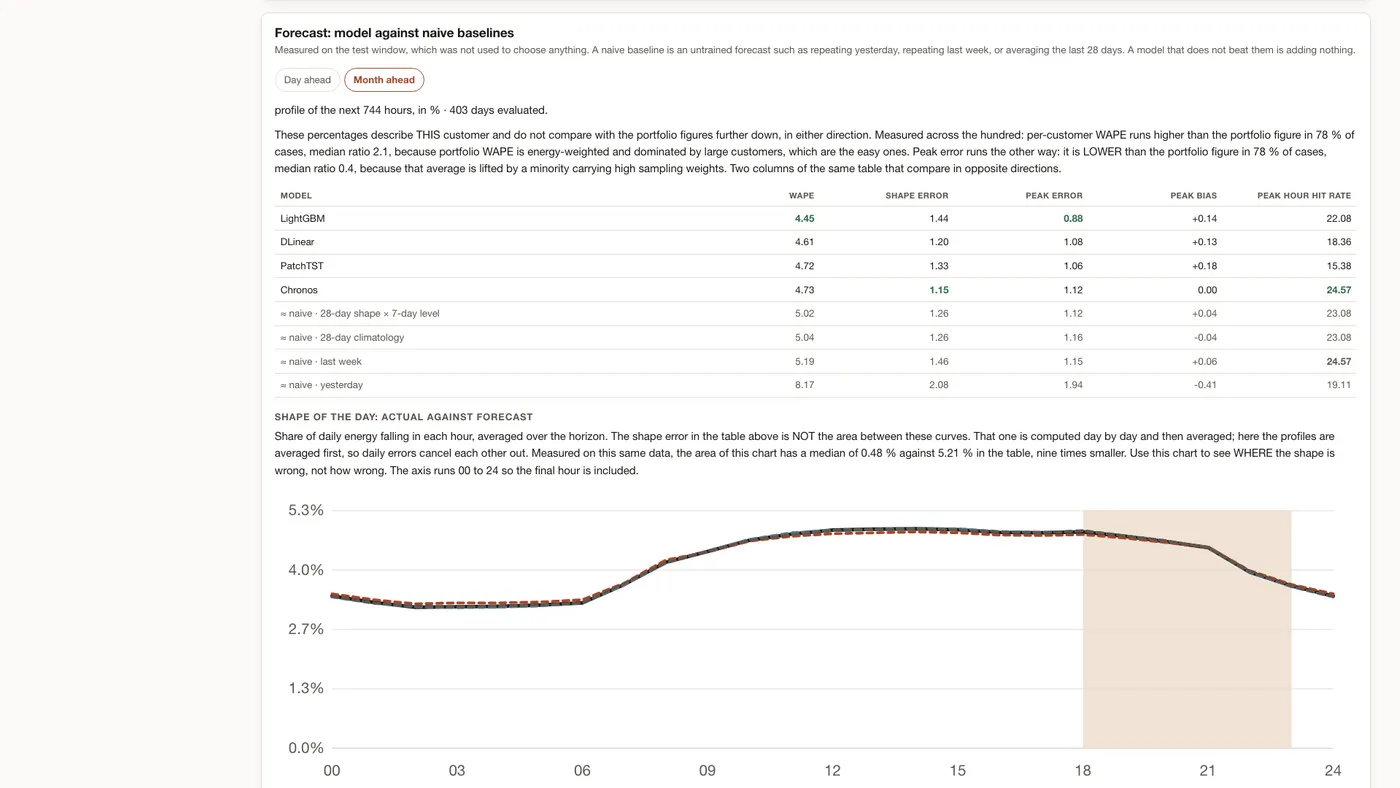
- Predicting when, not only how much. Peak-hour energy is billed separately in the Peruvian free market and contracted capacity is sized on it, so two clients drawing the same 900 MWh pay different invoices. A separate hourly panel of 54.9M rows, with its own shape and peak metrics, cuts day-ahead error from 8.10% to 4.14% using PatchTST, and the difficult tail improves from 54.9% to 34.9% at the 90th percentile. Chronos in zero shot beats a LightGBM trained on six years of local data, 4.49% against 4.82%, without having seen a Peruvian kilowatt-hour or the local holiday calendar.
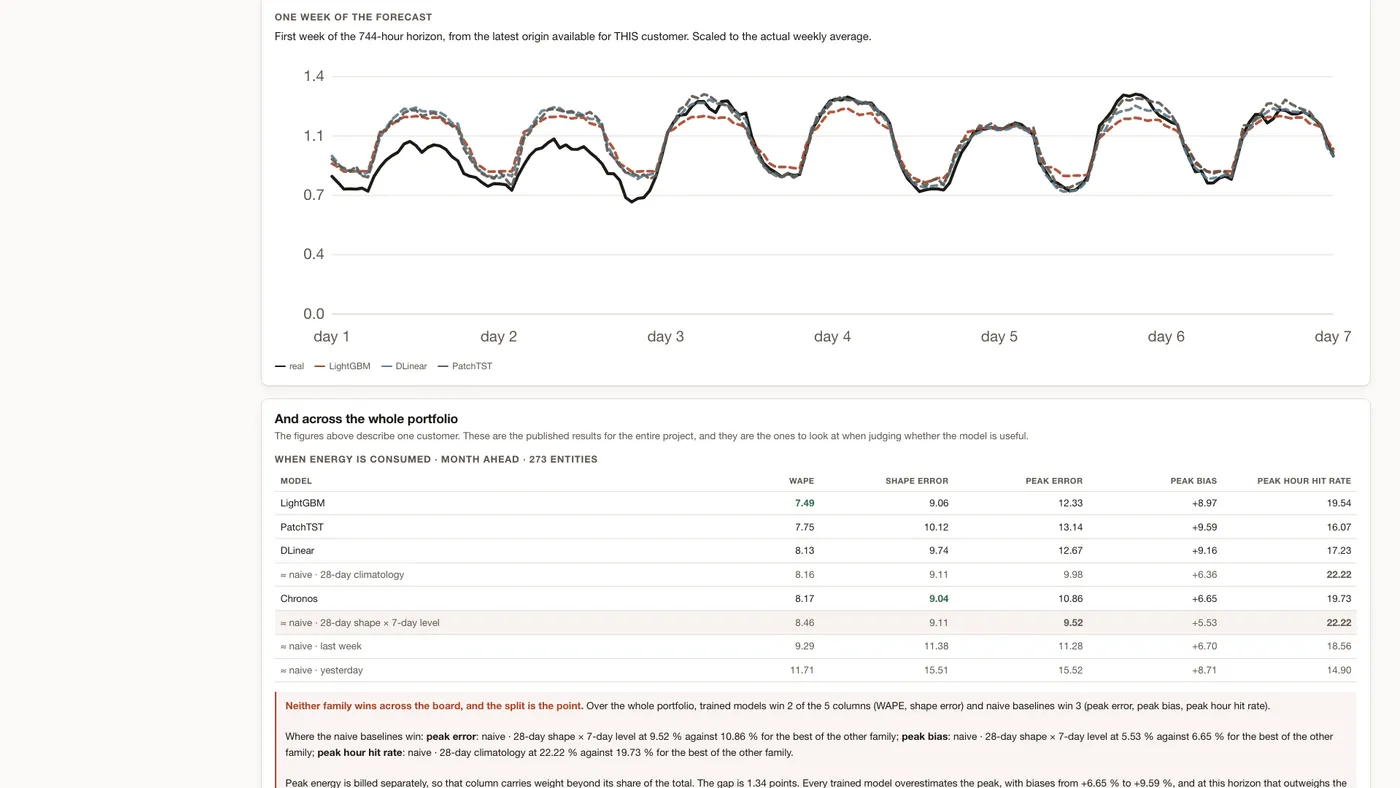
- The demo shows the column where the naive wins. At the month-ahead horizon, which is the only one the COES publication cadence allows, a four-week average beats every trained model on peak-hour error. The page reports the win split column by column rather than picking a favourable one, computing it from the same table it displays so the text cannot go stale, and a test fails the day the claim stops being true.
- Clients you can flag as unpredictable before predicting them. One in ten passes 50% error, and the coefficient of variation of their daily energy, already on the client card, ranks clients almost the way the error itself does. Measured on the 272 cohort entities with at least 60 days of prior history, rank correlation with test WAPE is +0.75 and a cut at 0.53 captures 88% of those above 50%. The ceiling is measured too: handing the model each day’s true total, an oracle that does not exist, that band still sits at 21% median WAPE, which makes it a data problem rather than an architecture one.
- A reader that never materializes the sheet. Each monthly Excel is 105 MB on disk and 612 MB of XML once inflated, so any library that builds the sheet in memory needs gigabytes per file. The Rust reader streams the zip, keeps one reused row buffer, walks the full 612 MB in 2.8 seconds at 12.6 MB of RSS, and unpivots straight into binary COPY at around 630k rows per second. The production image is scratch: a single static musl binary with the TLS roots compiled in.
- The domain is where the work is. COES republishes each month several times and revision folders hold different sets of reports, so the authoritative revision resolves per report family and period rather than per folder. The 15-minute report appears under 18 spellings. Three files contain data from a different month than their folder claims, which emptied one month and double-counted another until a dbt test caught it, so a file now counts as authoritative only when the period inside its data matches its path. The panel grain is the client rather than the supply code, because 82.1% of codes that started drawing energy in 2025 belong to clients already active and half the dead codes reappear each January under a new number.
- Leakage is tested as a property, not a value. Features live in SQL, so dbt’s own tests verify they close at t−1, and the Python side checks the stronger property that a feature’s value must not change when later rows are deleted, recomputing on the truncated series with a counter-test proving the leaky version would differ. The hourly panel adds a poison test that sets everything after the origin to infinity and asserts no feature comes out non-finite, which keeps holding when a feature is added later.
- A warehouse sized by measurement. The full backfill loaded 2.01 billion raw rows into 908M conformed fact rows. Seven-day chunks align exactly with columnstore batches, the fact table carries zero indexes by design, and compression measured 7.9× on the backfill, and the whole database, hourly panel and feature marts included, sits at 87 GB today. The dbt project runs 229 tests over 22 models, and the singular ones encode domain invariants, including an interval-convention test that catches losing exactly one 15-minute block per month, which no generic check can see because every mart loses the same block.